
Therapy Access Quantification
What does your therapy mean for care delivery in numbers?
Therapy Access Quantification reveals the actual effort a therapy entails in clinical practice and the operational and economic value differences compared to the standard therapy can create.
We quantify processes, personnel effort, resources, and costs directly along the real treatment pathway.

From Potential to Measurable Impact
Quantification along the real treatment pathway
While Therapy Access Screening identifies relevant differentiation potentials, Quantification examines how significant these differences actually are in care practice.
To do this, we record and quantify the relevant steps of the treatment pathway and their impact on the healthcare provider.
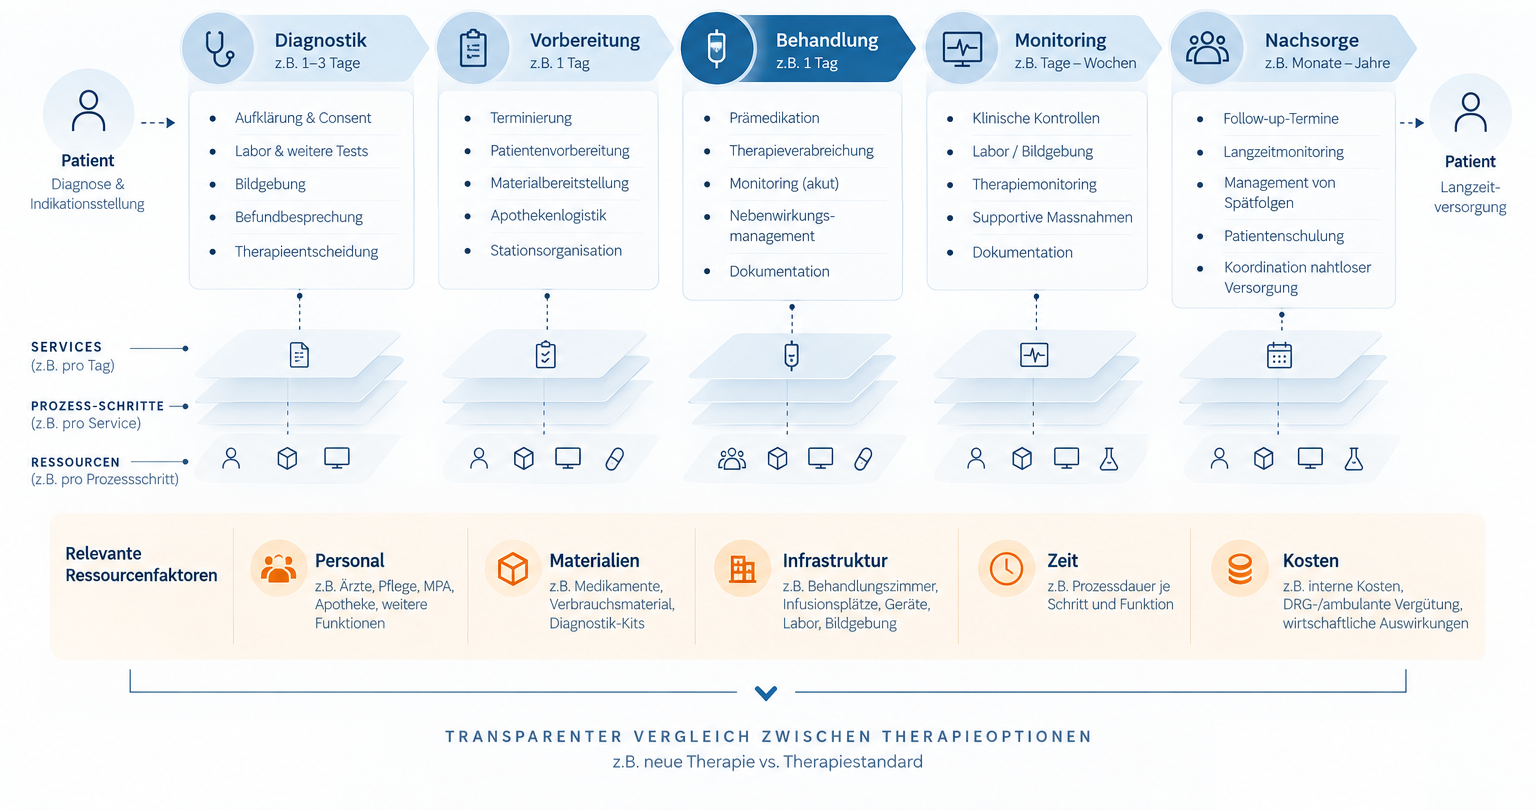
The Central Output
Care Effort Made Transparent
Therapy Access Quantification structures the treatment pathway and makes visible where time and resources are utilized and what differences arise between therapy options.
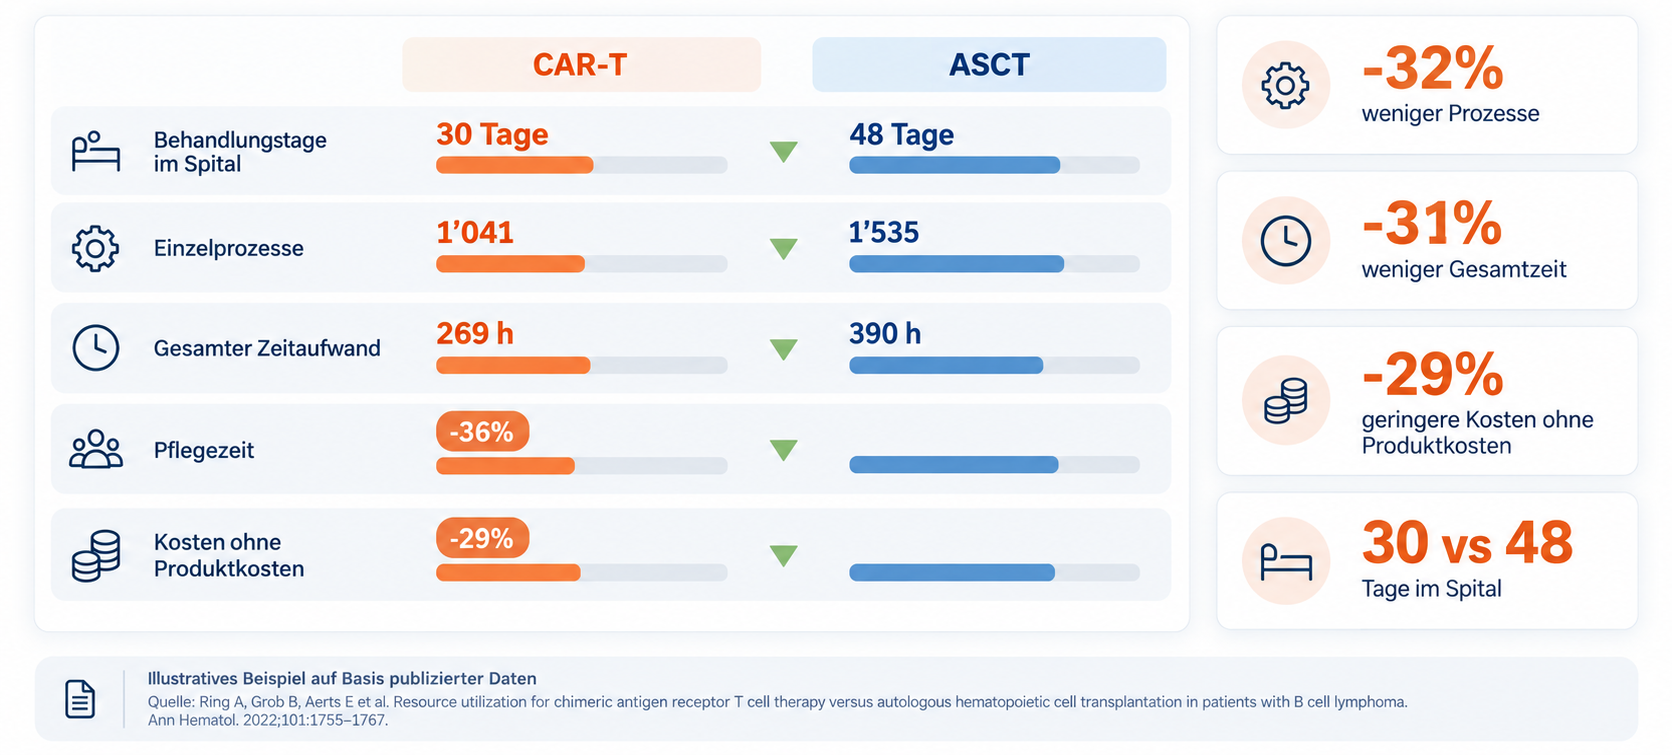
This makes operational differences measurable and comparable, rather than merely described.
What We Quantify
From individual process steps to the entire treatment pathway
For each relevant process step, we record time expenditure, involved professional groups, required resources, and associated costs. This provides a granular and transparent view of the actual care effort of a therapy and the differences compared to other therapy options.

Personnel
Time expenditure by involved professional groups
Processes
Effort of individual services and process steps
Resources
Materials, infrastructure, and treatment capacities
Costs
Provider-side costs and –
where relevant – economic impacts
The Methodology
From Real-World Care to a Quantified Model
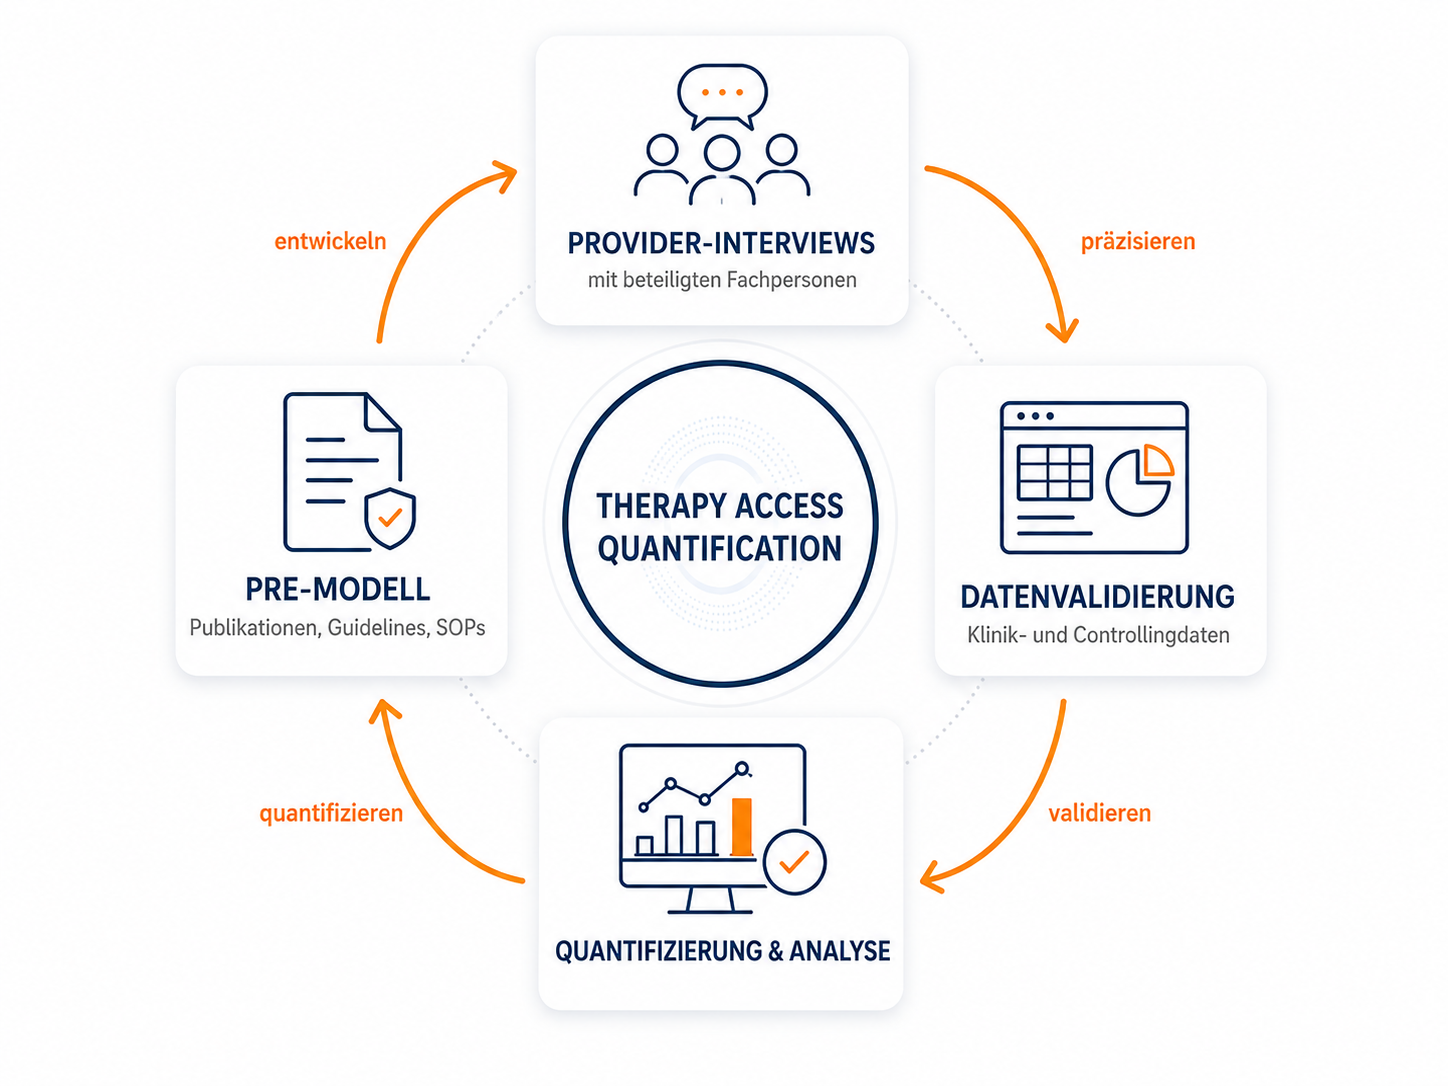
Therapy Access Quantification combines existing evidence with structured input from clinical practice and available hospital data.
01 — PRE-MODEL
Based on existing sources, we develop an initial model of the treatment pathway.
02 — PROVIDER INTERVIEWS
Together with the involved specialists, we validate and refine processes and resource expenditures.
03 — INTEGRATION OF CONTROLLING DATA
Available hospital and controlling data supplement the model.
04 — QUANTIFICATION & ANALYSIS
The validated process data are consolidated into a transparent Therapy Access Model.
Efficient Data Collection: Our structured and pragmatic approach minimizes the effort for involved hospital staff.
Your Strategic Added Value
Operational differences become demonstrable value.

Substantiate Differentiation
Make Provider Value Visible
Strengthen Adoption Arguments
Identify Bottlenecks
Your Result
Numbers that are relevant to the provider.
You receive a validated Therapy Access Model with transparent quantification of the treatment pathway and relevant differences compared to the standard therapy or competitors.
As four deliverables:
Treatment Flow Model
Mapping of the real treatment pathway
Resource & Revenue Quantification (Coverage)
Quantification of personnel and resource expenditure and comparison with revenue.
Therapy Comparison
Direct comparison of relevant therapy options
Executive Summary & Key Insights
Condensation of the most important provider-relevant insights

Therapy Access Quantification
In 3 months
Price: on request
Robust numbers from real clinical practice.
Validation and quantification of your therapy processes
We analyze staff hours, infrastructure requirements, and material costs
Board-ready for Marketing, Medical & Access.
In under 90 days
Let’s talk
Not yet sure what should be quantified?
Therapy Access Screening first identifies relevant operational differentiation potentials and helps prioritize which questions warrant in-depth quantification.

How significant is the actual Provider Value of your therapy?
Quantified results in under 90 days.